Example notebook
The tour notebook loads a 24-sequence protein alignment and explores it with the widgets. It computes p-distances and a neighbour-joining tree in plain Python, then links all three views.
View on GitHub Open in nbviewerTo run it, clone the repository and open packages/python/examples/tour.ipynb. Its data files sit
next to it in data/.
pip install react-bio-viz jupyterlabjupyter lab packages/python/examples/tour.ipynbThe screenshots below are from the notebook running in JupyterLab.
1. Explore an alignment
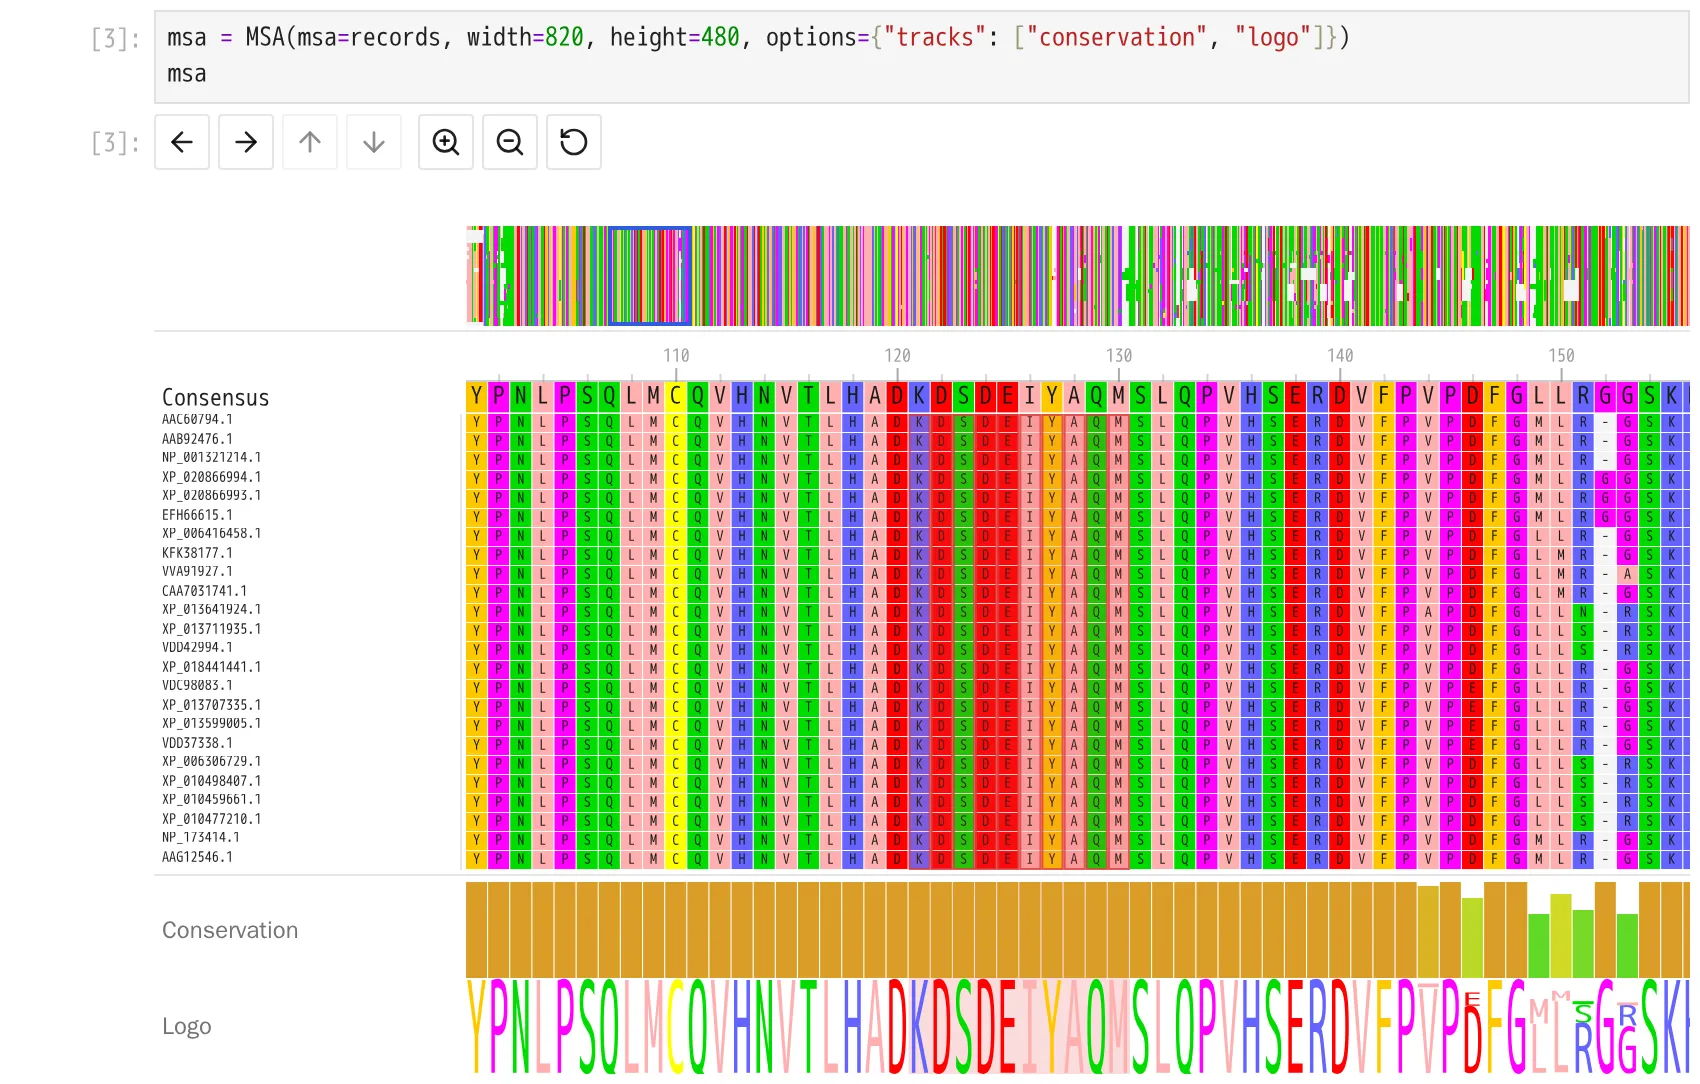
Section titled “1. Explore an alignment”read_fasta loads the records and MSA shows them, here with conservation and logo tracks. Pan,
zoom, select and drag labels as in the live examples.
2. Read, drive and observe state
Section titled “2. Read, drive and observe state”The notebook reads msa.selection after you select something. It prints each new selection into an
Output widget as it happens, and then drives the view from Python:
msa.viewport = {**msa.viewport, "x0": 100, "x1": 160}msa.options = {**msa.options, "colorStyle": "AA Zappo"}msa.selection = {"rows": [], "columns": list(range(120, 130))}3. Edit
Section titled “3. Edit”Rename, row-removal and column-removal callbacks apply each edit to msa.msa. Double-click a label
to rename it, hover a label for its ×, or select columns and press Delete.
4. Distances, linked to the alignment
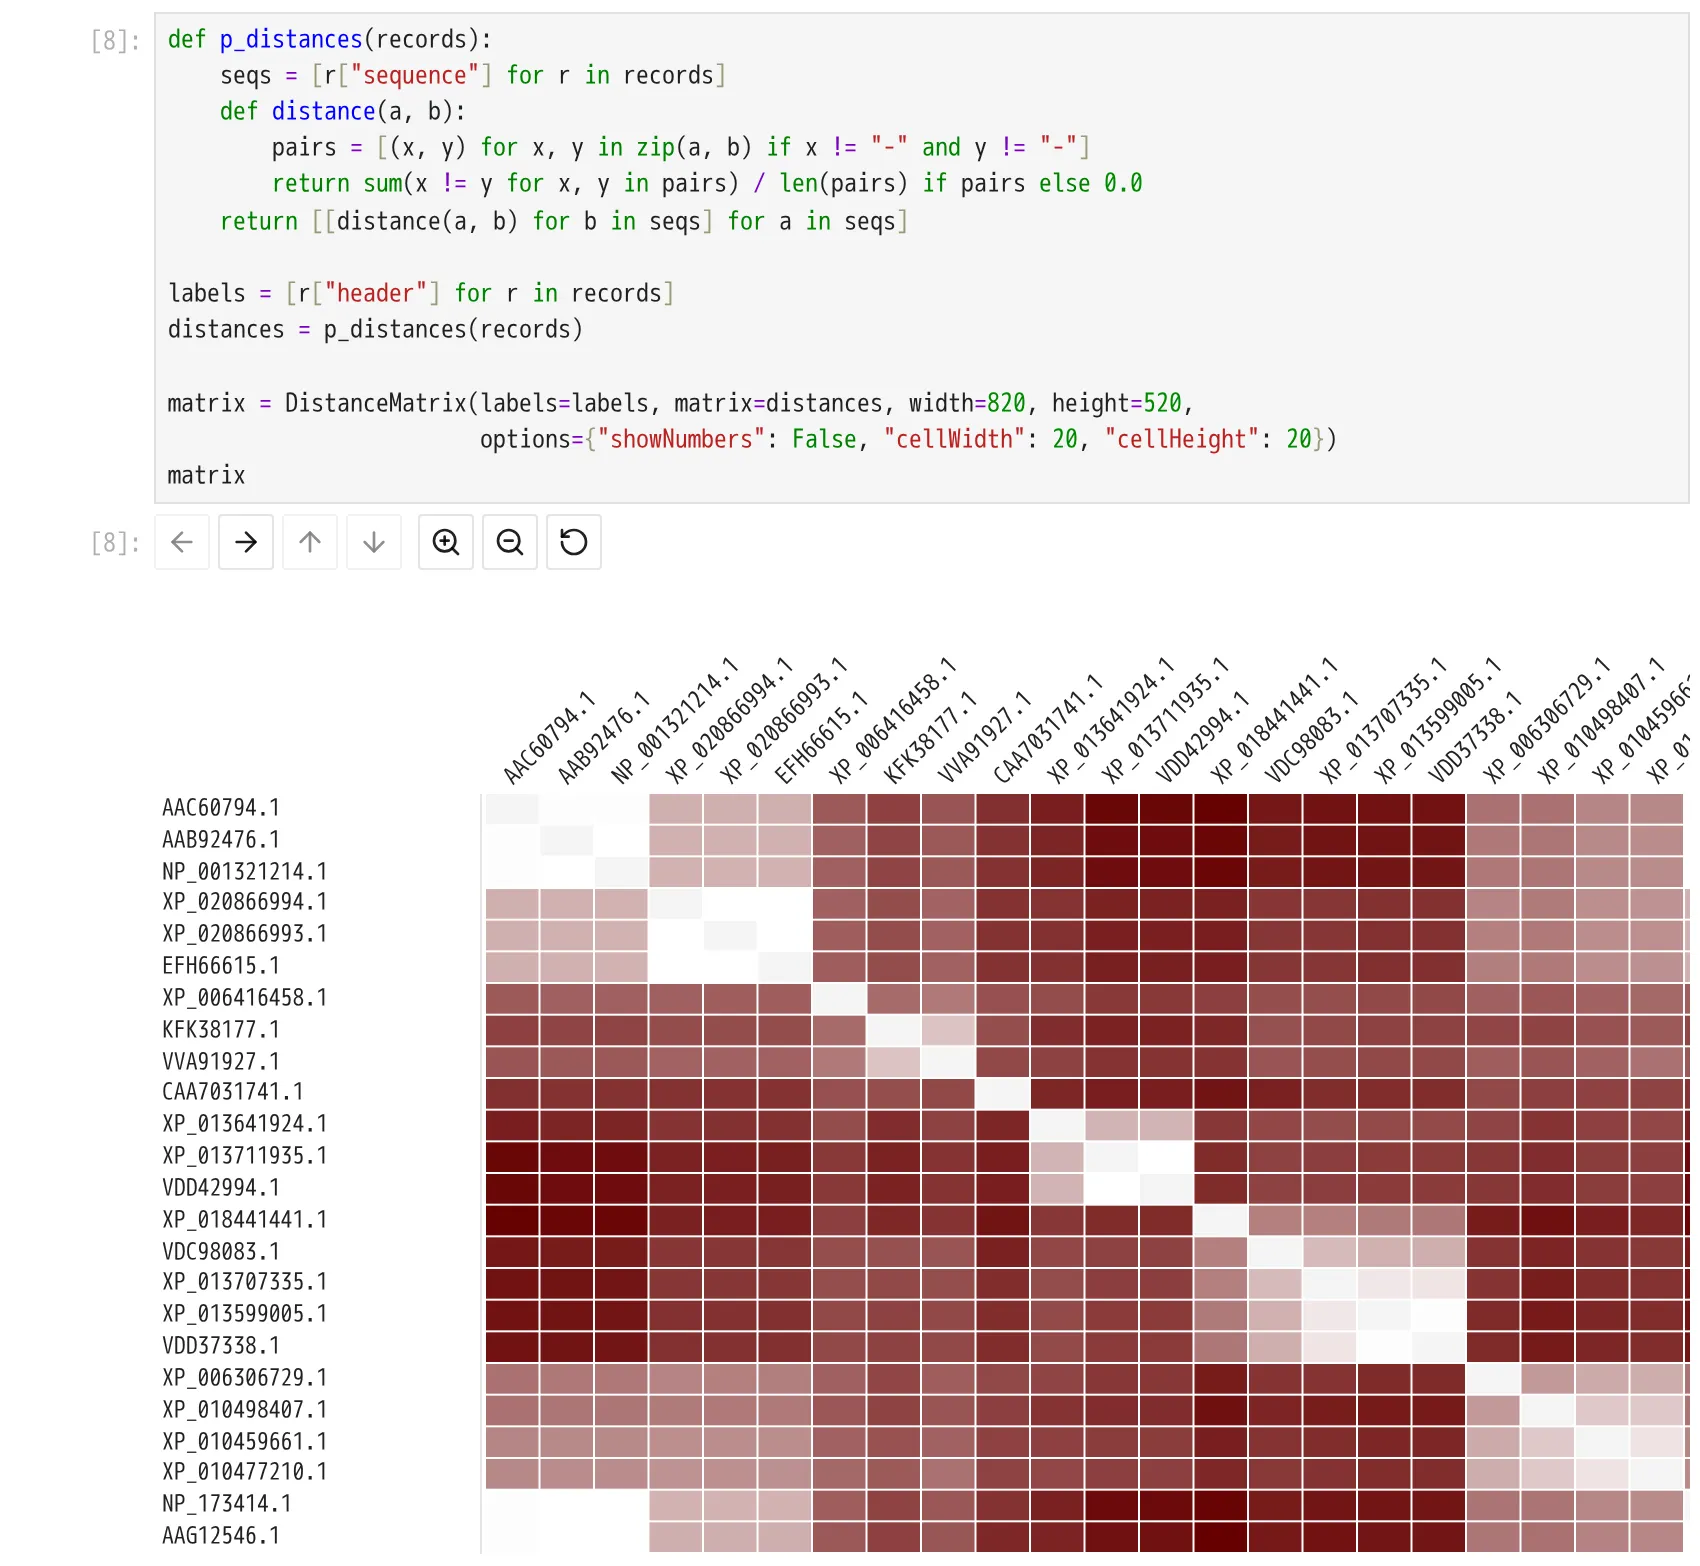
Section titled “4. Distances, linked to the alignment”p-distances computed in Python go into a DistanceMatrix. One traitlets.link on row_order
keeps it in step with the alignment.
5. A tree that orders the rows
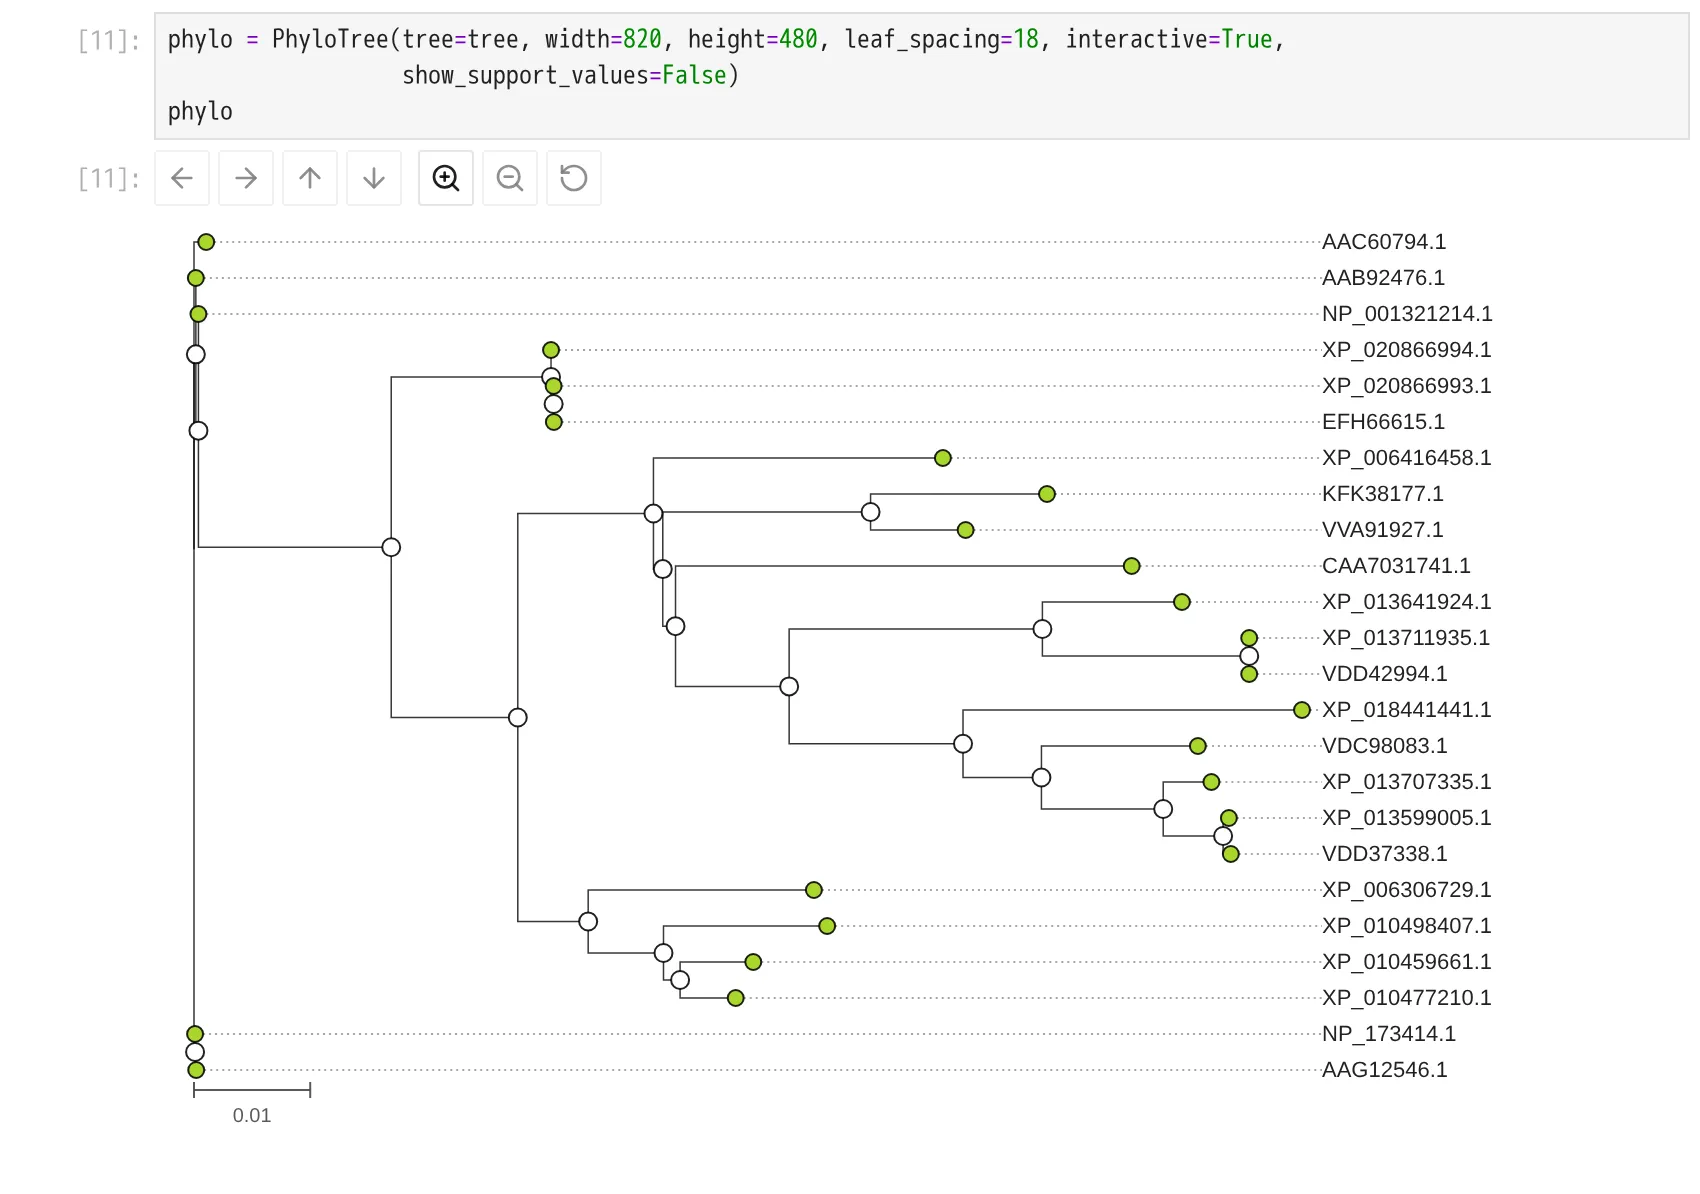
Section titled “5. A tree that orders the rows”A short neighbour-joining implementation turns the distances into a tree. traitlets.dlink from
its leaf_order makes the alignment rows (and so the matrix) follow the tree. Drag a node to
rotate it, or past the top or bottom to reroot. Clicks report the node, its leaves and
its descendants to a Python callback.
6. Newick, and genes
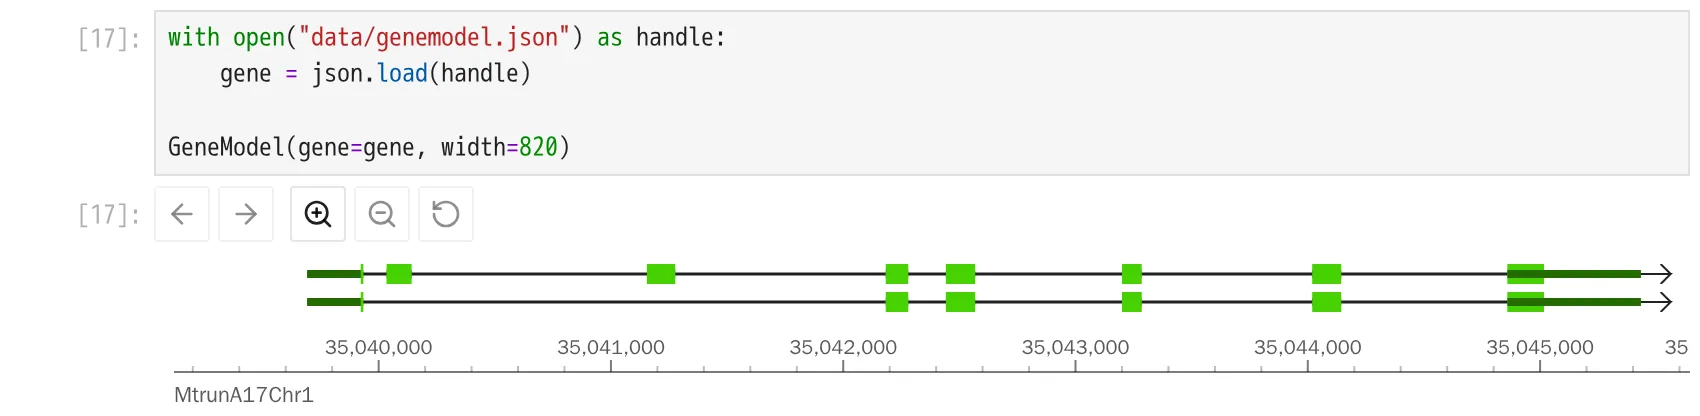
Section titled “6. Newick, and genes”to_newick and parse_newick round-trip the tree, and a GeneModel shows the transcripts, exons
and CDSs of a gene.